Showing posts with label rise. Show all posts

Tuesday, 26 July 2016

It could be unbearably hot in many places within a few years time


On July 24, 2016, 21:00 UTC, it was 98.7�F or 37.1�C at the green circle on above image. Because humidity at the time was 72% and wind speed was 2 mph or 3 km/h, it felt like it was 140.4�F or 60.2�C.


Above image shows temperatures, i.e. 98.7�F or 37.1�C at the green circle.


Above image shows that relative humidity was 72% at the green circle.


This event occurred at a location on the border of Missouri and Arkansas, just within Missouri, as is also indicated by the red marker above Google Maps image.

The image on the right, from the IPCC, shows the effect on extreme temperatures when (a) the mean temperature increases, (b) the variance increases, and (c) when both the mean and variance increase for a normal distribution of temperature. This shows how a relatively small temperature rise can result in a dramatic rise in the occurrence of hot and record hot weather.

The 'Misery Index' is the perceived air temperature as a combination of wind chill and heat index (which combines air temperature and relative humidity, in shaded areas). As temperatures and humidity levels keep rising, there comes a point where the wind factor no longer matters, in the sense that wind can no longer provide cooling. The thermodynamic wet-bulb temperature is determined by temperature, humidity and pressure (hPa), and it is the lowest temperature that can be achieved by evaporative cooling of a water-wetted ventilated surface. Once the wet bulb temperature reaches 35�C, one can no longer lose heat by perspiration, even in strong wind, but instead one will start gaining heat from the air beyond a wet bulb temperature of 35�C.


The above combination of 37.1�C at 72% at a pressure of 1013 hPa translates in a wet bulb temperature of 32.43�C. Had humidity risen to 87% while temperature remained at 37.1�C, the wet bulb temperature would have risen above 35�C. Alternatively, had the temperature risen to 39.9�C while humidity remained at 72%, the wet bulb temperature would also have risen above 35�C.

This goes to show how close the world is to unbearable heat. After all, this event occurred in Missouri, i.e. at some distance from the Equator, implying that, as temperatures and humidity levels keep rising, it could be unbearably hot in many places within a few years time. As discussed in a recent post, the world could be 10�C or 18�F warmer in ten years time.

The situation is dire and calls for comprehensive and effective action as described in the Climate Plan.


Links

- Climate Plan
http://arctic-news.blogspot.com/p/climateplan.html

- Wet-bulb temperature
https://en.wikipedia.org/wiki/Wet-bulb_temperature

- What is Wet Bulb temperature? By Steven Sherwood
http://web.science.unsw.edu.au/~stevensherwood/wetbulb.html

- NOAA wet bulb calculator
http://www.srh.noaa.gov/epz/?n=wxcalc_rh

- Dry Bulb, Wet Bulb and Dew Point temperatures
http://www.engineeringtoolbox.com/dry-wet-bulb-dew-point-air-d_682.html

- Heat Index
https://en.wikipedia.org/wiki/Heat_index
http://www.nws.noaa.gov/os/heat/heat_index.shtml

- NOAA Heat Index calculator
http://www.wpc.ncep.noaa.gov/html/heatindex.shtml

- Wind chill
https://en.wikipedia.org/wiki/Wind_chill

- NOAA Meteorological Conversions and Calculations
http://www.wpc.ncep.noaa.gov/html/calc.shtml

- An adaptability limit to climate change due to heat stress - by Steven Sherwood and Matthew Huber
http://www.pnas.org/content/107/21/9552.abstract

- The Deadly Combination of Heat and Humidity
http://www.nytimes.com/2015/06/07/opinion/sunday/the-deadly-combination-of-heat-and-humidity.html

- Researchers find future temperatures could exceed livable limits
http://www.purdue.edu/newsroom/research/2010/100504HuberLimits.html

- Intergovernmental Panel of Climate Change (IPCC), 3rd Assessment Report, Working Group I: The Scientific Basis
https://www.ipcc.ch/ipccreports/tar/wg1/088.htm

- A Global Temperature Rise Of More than Ten Degrees Celsius By 2026?
http://arctic-news.blogspot.com/2016/07/a-global-temperature-rise-of-more-than-ten-degrees-celsius-by-2026.html

- WMO examines reported record temperature of 54�C in Kuwait, Iraq
http://public.wmo.int/en/media/news/wmo-examines-reported-record-temperature-of-54�c-kuwait


Friday, 15 July 2016

A Global Temperature Rise Of More than Ten Degrees Celsius By 2026?

How much have temperatures risen and how much additional warming could eventuate over the next decade? The image on the right shows a potential global temperature rise by 2026 from pre-industrial levels. This rise contains a number of elements, as discussed below from the top down.

February 2016 rise from 1900 (1.62�C)

The magenta element at the top reflects the temperature rise since 1900. In February 2016, it was 1.62�C warmer compared to the year 1900, so that's a rise that has already manifested itself.

Rise from pre-industrial levels to 1900 (0.3�C)

Additional warming was caused by humans before 1900. Accordingly, the next (light blue) element from the top down uses 0.3�C warming to reflect anthropogenic warming from pre-industrial levels to the year 1900.

When also taking this warming into account, then it was 1.92�C (3.46�F) warmer in February 2016 than in pre-industrial times, as is also illustrated on the image below.


Warming from the other elements (described below) comes on top of the warming that was already achieved in February 2016.

Rise due to carbon dioxide from 2016 to 2026 (0.5�C)

The purple element reflects warming due to the amount of carbon dioxide in the atmosphere by 2026. While the IEA reported that energy-related carbon dioxide emissions had not risen over the past few years, carbon dioxide levels in the atmosphere have continued to rise, due to feedbacks that are kicking in, such as wildfires and reduced carbon sinks. Furthermore, maximum warming occurs about one decade after a carbon dioxide emission, so the full warming wrath of the carbon dioxide emissions over the past ten years is still to come. In conclusion, an extra 0.5�C warming by 2026 seems possible as long as carbon dioxide levels in the atmosphere and oceans remain high and as temperatures keep rising.

Removal of aerosols masking effect (2.5�C)

With dramatic cuts in emissions, there will also be a dramatic fall in aerosols that currently mask the full warming of greenhouse gases. From 1850 to 2010, anthropogenic aerosols brought about a decrease of ~2.53 K, says a recent paper. While on the one hand not all of the aerosols masking effect may be removed over the next ten years, there now are a lot more aerosols than in 2010. A 2.5�C warming due to removal of part of the aerosols masking effect therefore seems well possible by the year 2026.

Albedo changes in the Arctic (1.6�C) 

Warming due to Arctic snow and ice loss may well exceed 2 W per square meter, i.e. it could more than double the net warming now caused by all emissions by people of the world, calculated Professor Peter Wadhams in 2012. A 1.6�C warming due to albedo changes (i.e. decline of both Arctic sea ice and snow and ice cover on land) therefore seems well possible by the year 2026.

Methane eruptions from the seafloor (1.1�C)

". . we consider release of up to 50 Gt of predicted amount of hydrate storage as highly possible for abrupt release at any time," Dr. Natalia Shakhova et al. wrote in a paper presented at EGU General Assembly 2008. Authors found that such a release would cause 1.3�C warming by 2100. Note that such warming from an extra 50 Gt of methane seems conservative when considering that there now is only some 5 Gt of methane in the atmosphere, and over a period of ten years this 5 Gt is already responsible for more warming than all the carbon dioxide emitted by people since the start of the industrial revolution. Professor Peter Wadhams co-authored a study that calculated that methane release from the seafloor of the Arctic Ocean could yield 0.6�C warming of the planet in 5 years (see video at earlier post). In conclusion, as temperatures keep rising, a 1.1�C warming due to methane releases from clathrates at the seafloor of the world's oceans seems well possible by the year 2026.

Extra water vapor feedback (2.1�C)

Rising temperatures will result in more water vapor in the atmosphere (7% more water vapor for every 1�C warming), further amplifying warming, since water vapor is a potent greenhouse gas. Extra water vapor will result from warming due to the above-mentioned albedo changes in the Arctic and methane releases from the seafloor that could strike within years and could result in huge warming in addition to the warming that is already there now. As the IPCC says: "Water vapour feedback acting alone approximately doubles the warming from what it would be for fixed water vapour. Furthermore, water vapour feedback acts to amplify other feedbacks in models, such as cloud feedback and ice albedo feedback. If cloud feedback is strongly positive, the water vapour feedback can lead to 3.5 times as much warming as would be the case if water vapour concentration were held fixed", according to the IPCC. Given a possible additional warming of 2.7�C due to just two elements, i.e. Arctic albedo changes and seafloor methane, an additional warming over the next decade of 2.1�C due to extra water vapor in the atmosphere therefore does seem well possible by the year 2026.

Further feedbacks (0.3�C)

Further feedbacks will result from interactions between the above elements. Additional water vapor in the atmosphere and extra energy trapped in the atmosphere will result in more intense storms and precipitation, flooding and lightning. Flooding can cause rapid decomposition of vegetation, resulting in strong methane releases. Furthermore, plumes above the anvils of severe storms can bring water vapor up into the stratosphere, contributing to the formation of cirrus clouds that trap a lot of heat that would otherwise be radiated away, from Earth into space. The number of lightning strikes can be expected to increase by about 12% for every 1�C of rise in global average air temperature. At 3-8 miles hight, during the summer months, lightning activity increases NOx by as much as 90% and ozone by more than 30%. The combination of higher temperatures and more lightning will also cause more wildfires, resulting in emissions such as of methane and carbon monoxide. Ozone acts as a direct greenhouse gas, while ozone and carbon monoxide can both act to extend the lifetime of methane. Such feedbacks may well result in an additional 0.3�C warming by the year 2026.

Total potential global temperature rise by 2026 (10�C or 18�F)

Adding up all the warming associated with the above elements results in a total potential global temperature rise (land and ocean) of more than than 10�C or 18�F within a decade, i.e. by 2026. As said before, this scenario assumes that no geoengineering will take place over the next decade.

The situation is dire and calls for comprehensive and effective action as described in the Climate Plan.


Monday, 4 July 2016

2016 Arctic Sea Ice Headed To Zero

The image below shows that Arctic sea ice extent on July 3, 2016, was 8,707,651 square km, i.e. less than the 8.75 million square km that extent was on July 3, 2012.


In September 2012, Arctic sea ice extent reached a record low. Given that extent now is only slightly lower than it was in 2012 at the same time of year, can extent this year be expected to reach an even lower minimum, possibly as low as zero ice in September 2016?

The ice this year is certainly headed in that direction, given that the sea ice now is much thinner than it was in 2012. The image below shows sea ice thickness on July 7, 2012, in the left-hand panel, and adds a forecast for July 7, 2016 in the right-hand panel.


Besides being thinner, sea ice now is also much more slushy and fractured into small pieces. The animation below shows that the sea ice close to the North Pole on July 4, 2016, was heavily fractured into pieces that are mostly smaller in size than 10 x 10 km or 6.2 x 6.2 miles. By comparison, sea ice in the same area did develop large cracks in 2012, but even in September 13, 2012, it was not broken up into small pieces.


One big reason behind the dire state the sea ice is in now is ocean heat. On July 2, 2016, sea surface near Svalbard (at the location marker by the green circle) was as warm as 16.7�C or 62.1�F, i.e. 13.5�C or 24.3�F warmer than 1981-2011. This gives an indication how much warmer the water is that is entering the Arctic Ocean.


As the sea ice disappears, less sunlight gets reflected back into space, resulting in additional warming of the Arctic Ocean. In October 2016, the sea ice will return, sealing off the Arctic Ocean, resulting in less heat being able to escape, at the very time the warmest water is entering the Arctic Ocean from the Atlantic and Pacific Oceans. The danger of this situation is that a large amount of heat will reach the seafloor and destabilize hydrates, resulting in huge abrupt methane releases that will further contribute to warming. When adding in further factors such as discussed e.g. at this earlier post, this adds up to a potential temperature rise of more than 10�C or 18�F compared to pre-industrial times in less than ten years time from now.

The situation is dire and calls for comprehensive and effective action, as described at the Climate Plan.


Friday, 17 June 2016

Ocean Heat Overwhelming North Atlantic

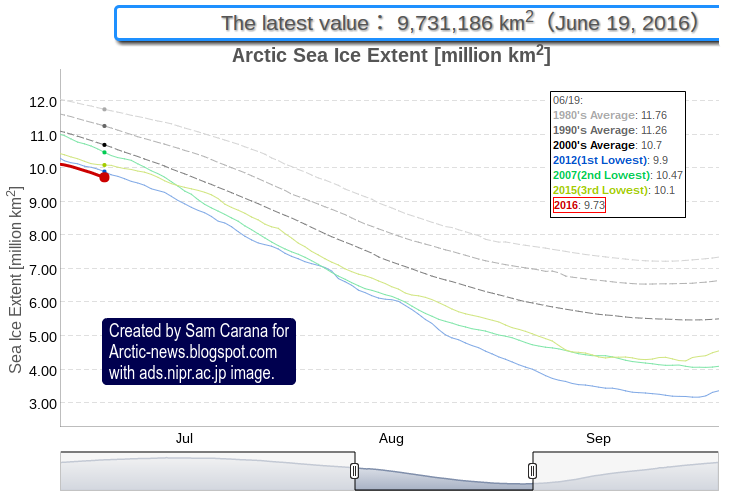
Arctic sea ice extent on June 19, 2016, was at a record low for the time of the year, as the (updated) image below shows.

[ image from JAXA ]
Not only is Arctic sea ice extent at record low for time of year, the sea ice is also rapidly getting thinner, more fractured, lower in concentration and darker in color. 

[ Cracks in sea ice north of Greenland on June 19, 2016, created with Arctic-io image ]
On the morning of June 20, 2016, strong methane releases were recorded over the water north of Greenland, as well as east of Greenland, as illustrated by the image below.

The image below shows that on the morning of June 20, 2016, mean global methane levels had increased be several parts per billion over a large altitude range, compared to the two previous days. Methane levels at selected altitudes on days in July 2015 and December 2015 are added for reference.
[ click on images to enlarge ]
Temperatures in the Arctic are rising, as illustrated by the image below, showing that on June 19, 2016, temperatures were as high as 31.4�C or 88.4�F over the Mackenzie River (green circle) which ends in
the Arctic Ocean (and thus warms up the Arctic Ocean there).


On June 20, 2016, the Sun will reach its highest point (Solstice), and the Arctic will have 24 hours sunlight, i.e. on the Arctic Circle (latitude 66.56� north) or higher. The Arctic is about 20,000,000 square km (7,700,000 square miles) in size and covers roughly 4% of Earth's surface. Insolation during the months June and July is higher in the Arctic than anywhere else on Earth, as illustrated by the image below, by Pidwirny (2006).


Sea surface temperature near Svalbard was as high as 55�F (or 12.8�C, at the green circle) on June 14, 2016, an anomaly of 19.6 �F (or 10.9�C) from 1981-2011, as illustrated by the image below.


[ click on images to enlarge ]
Above image, created with nullschool.net, further shows that the cold lid that had been growing so prominently in extent over the North Atlantic over the past few years, has shrunk substantially. By comparison, the cold area over the North Pacific has grown larger. This is further confirmed by the image on the right, created with NASA maps and showing ocean temperature anomalies for May 2016.

Plenty of meltwater has run off from Greenland in 2016, as illustrated by the NSIDC.gov image on the right. The run-off from Alaska and Siberia into the Pacific seems less by comparison than the run-off into the North Atlantic. So, how could it be that the cold area in the North Pacific has grown larger than the cold area in the North Atlantic?
[ click on images to enlarge ]

Could there be another factor influencing the size of these cold areas in the North Atlantic and the North Pacific?

The image below, created with NOAA images, gives a comparison between the situation on June 1, 2015 (top), and June 1, 2016 (bottom), showing anomalies from 1961-1990.


The difference is striking, especially when considering the strength of the colder anomalies (from 1961-1990). Besides meltwater, something else must be influencing the size and strength of these anomalies in the North Atlantic and the North Pacific in different ways. Quite likely, the difference is caused by the Global Ocean Conveyor Belt (or thermohaline circulation), which is carrying warm water into the North Atlantic, while carrying cold water out of the North Atlantic. In the North Pacific, it is doing the opposite, i.e. carrying cold water in, while carrying warm water out of the North Pacific.

[ Note that this animation is a 2.3 MB file that make take some time to fully load ]
In conclusion, there are several factors that are influencing the situation, including the influence El Ni�o has had and the impact La Ni�a will have, and changes to ocean currents. Even if the Conveyor Belt may slow down, more important than its speed is how much heat it will carry into Arctic Ocean. The image below shows a trend pointing at the water on the Northern Hemisphere getting 2 degrees Celsius warmer well before the year 2030, compared to the 20th century average.

If such trends continue or even strengthen, ever warmer water will be carried from the North Atlantic into the Arctic Ocean, overwhelming possible cooling due to meltwater run-off. Since the Atlantic inflow is about 10 times greater in volume than the Pacific inflow, the net result will be further speeding up of the warming of the Arctic Ocean.

A warmer Arctic Ocean will speed up decline of the sea ice, causing more sunlight to be absorbed by the Arctic Ocean, as one of the feedbacks that are further accelerating warming of the Arctic Ocean. Feedback #14 refers to (latent) heat that previously went into melting. With the demise of the sea ice, an increasing proportion of the ocean heat gets absorbed by the Arctic Ocean.

As the sea ice heats up, 2.06 J/g of heat goes into every degree Celsius that the temperature of the ice rises. While the ice is melting, all energy (at 334J/g) goes into changing ice into water and the temperature remains at 0�C (273.15K, 32�F).

Once all ice has turned into water, all subsequent heat goes into heating up the water, at 4.18 J/g for every degree Celsius that the temperature of water rises.

The amount of energy absorbed by melting ice is as much as it takes to heat an equivalent mass of water from zero to 80�C.


The sea ice is in a bad shape, as also illustrated by the above concentration comparison, between June 24, 2012, and a forecast for June 24, 2016.


As above comparison shows, the sea ice is now also much thinner than it was in 2012. Thick sea ice used to extend meters below the sea surface in the Arctic, where it could consume massive amounts of ocean heat through melting this ice into water. As such, thick sea ice acted as a buffer. Over the years, Arctic sea ice thickness has declined most dramatically. This means that the buffer that used to consume massive amounts of ocean heat carried by sea currents into the Arctic Ocean, has now largely gone.

Latent heat loss, feedback #14 on the Feedbacks page
The danger is that heat will reach the seafloor and will destabilize methane hydrates contained in sediments at the seafloor of the Arctic Ocean.

The situation is dire and calls for comprehensive and effective action as described at the Climate Plan.


Links

- NASA Study Finds Atlantic 'Conveyor Belt' Not Slowing (March 25, 2010)
jpl.nasa.gov/news/news.php?release=2010-101

- Arctic Ocean Circulation: Going Around At the Top Of the World, by Rebecca Woodgate (2013)
nature.com/scitable/knowledge/library/arctic-ocean-circulation-going-around-at-the-102811553

Pidwirny, M. (2006). "Earth-Sun Relationships and Insolation". Fundamentals of Physical Geography, 2nd Edition
physicalgeography.net/fundamentals/6i.html

Sunday, 5 June 2016

High Temperatures In Arctic

0-2000 m Global Ocean Heat Content
Ocean heat content is rising, as illustrated by the image on the right. Where the sea ice declines, this is causing high air temperatures in the Arctic.

This year (from January to April 2016) on the Northern Hemisphere, oceans were 0.85�C or 1.53�F warmer than the 20th century average.

The image below illustrates that temperatures look set to be high in Siberia for the coming week. The panel on the right shows anomalies at the top end of the scale in Eastern Siberia on June 5, 2016, while the panel on the right shows a forecast for June 12, 2016.


These high air temperatures are causing feedbacks that are in turn further speeding up warming in the Arctic.

Warmer Rivers

Temperatures as high as 28.9�C or 83.9�F were recorded over the Mackenzie River close to the Arctic Ocean on June 13, 2016, at location marked by the green circle.


Below is a satellite image of the Mackenzie River delta on June 11, 2016


The image below shows that temperatures as high as 36.6�C or 97.8�F were forecast for June 13, 2016, over the Yenisei River in Siberia that ends in the Arctic Ocean.


Wildfires

Earlier this month, temperatures in Eastern Siberia were as high as 29.5�C (85�F). This was on June 5, 2016, at a location close to the coast of the Arctic Ocean (green circle).


High air temperatures come with increased risk of wildfires, as illustrated by the image below showing carbon monoxide levels as high as 2944 ppb on June 4, 2016 (at green circle).


The satellite image below zooms into the area with these high carbon monoxide readings, showing wildfires on Kamchatka Peninsula on June 3, 2016.


Albedo Loss

The image on the right shows that, this year, April snow cover on the Northern Hemisphere was the lowest on record. The added trend points at a total absence of snow by the year 2036.

Professor Peter Wadhams, head of the Polar Ocean Physics Group at Cambridge University, says: �My prediction remains that the Arctic ice may well disappear, that is, have an area of less than one million square kilometres for September of this year.�

Warming due to Arctic snow and ice loss may well exceed 2 W per square meter, i.e. it could more than double the net warming now caused by all emissions by people of the world, Peter Wadhams calculated in 2012.

Seafloor Methane

Peter Wadhams further co-authored a study that calculated that methane release from the seafloor of the Arctic Ocean could yield 0.6�C warming of the planet in 5 years (see video interview of Thom Hartmann with Peter Wadhams below).


Combined Impact Of Multiple Feebacks

In conclusion, high air temperatures in the Arctic are very worrying, as they can trigger a number of important feedbacks, i.e. the ones discussed above and further feedbacks such as:
  • Changes to Jet Streams. As the Arctic warms more rapidly than the rest of Earth, changes are occurring to the jet streams. As a result, winds can increasingly bring hot air far to the north, resulting in further loss of the Arctic snow and ice cover, in turn further warming up the Arctic.
  • Warmer Rivers. High air temperatures cause warming of the water of rivers that end up in the Arctic Ocean, thus resulting in additional sea ice decline and warming of the Arctic Ocean all the way down to the seabed.
  • Wildfires. High air temperatures set the scene for wildfires that emit not only greenhouse gases such as carbon dioxide and methane, but also pollutants such as carbon monoxide that depletes hydroxyl that could otherwise break down methane, and black carbon that, when settling on ice, causes it to absorb more sunlight (see under albedo loss), besides being a climate forcer when in the atmosphere.
  • Soil destabilization. Heatwaves and droughts destabilize the soil. Soil that was previously known as permafrost, was until now held together by ice. As the ice melts, organic material in the soil starts decomposing, resulting in emissions of methane and carbon dioxide, while the soil becomes increasingly vulnerable to wildfires.
  • Buffer Loss. Arctic snow and ice cover acts as a buffer, absorbing heat that in the absence of this buffer will have to be absorbed by the Arctic Ocean, as discussed in earlier posts such as this one
  • Albedo Loss. Arctic snow and ice cover make that sunlight is reflected back into space. In the absence of this cover, the Arctic will have to absorb more heat.
  • Seafloor Methane. As sediments at the seafloor of the Arctic Ocean warm, hydrates contained in these sediments could be destabilized and release huge quantities of methane.

How much warmer could it be within one decade?

The two feedbacks mentioned by Peter Wadham (albedo and seafloor methane) are are depicted in the image below.

for further discussion, see the feedbacks page
The combined global temperature rise over the next decade due to these two feedbacks (albedo and seafloor methane) alone may be 0.4�C or 0.72�F for a low-rise scenario and may be 2.7�C or 4.9�F for a high-rise scenario.

Additionally, as temperatures rise, further feedbacks will kick in more strongly, further accelerating the rise in temperature, as also discussed in earlier posts such as this one.

When also including further feedbacks, warming could exceed 10�C (18�F) within one decade, assuming that no geoengineering will take place within a decade, as discussed in earlier posts such as this one.

The situation is dire and calls for comprehensive and effective action, as described at the Climate Plan.

Links

- Feedbacks in the Arctic
http://arctic-news.blogspot.com/p/feedbacks.html

- East Siberian Heatwave
http://arctic-news.blogspot.com/2015/07/east-siberian-heat-wave.html

- Wildfire Danger Increasing
http://arctic-news.blogspot.com/2016/05/wildfire-danger-increasing.html

- Albedo changes in the Arctic
http://arctic-news.blogspot.com/2012/07/albedo-change-in-arctic.html

- Three kinds of warming in the Arctic
http://arctic-news.blogspot.com/2016/02/three-kinds-of-warming-in-arctic.html

- Arctic could become ice-free for first time in more than 100,000 years, claims leading scientist
http://www.independent.co.uk/environment/climate-change/arctic-could-become-ice-free-for-first-time-in-more-than-100000-years-claims-leading-scientist-a7065781.html

- Greenhouse gas levels and temperatures keep rising
http://arctic-news.blogspot.com/2016/01/greenhouse-gas-levels-and-temperatures-keep-rising.html

- Arctic Methane Release: "Economic Time Bomb"
http://arctic-news.blogspot.com/2013/07/arctic-methane-release-economic-time-bomb.html

- February Temperature
http://arctic-news.blogspot.com/2016/03/february-temperature.html

- September 2015 Sea Surface Warmest On Record

Saturday, 28 May 2016

How Much Warming Have Humans Caused?

How much did temperatures rise?

Differences in baseline (reference period) can result in dramatic differences in temperature rise. The U.K. Met Office HadCRUT4 dataset typically presents temperature anomalies relative to a 1961-1990 baseline. NASA typically uses a 1951-1980 baseline, but the NASA website allows for different baselines to be selected. When selecting a 1961-1990 baseline, temperatures over the past half year were 1.05�C (1.89�F) higher than this baseline, as shown by the NASA map in the left panel of the image below. As the map in the right panel of the image below shows, when compared to 1890-1910, temperatures have risen by 1.48�C (or 2.664�F).


A polynomial trend can reduce variability such as caused by volcanoes and El Ni�o events. The graph below was created with the NASA L-OTI monthly mean global surface temperature anomaly, which has a 1951-1980 baseline, and then with 0.29�C added, which makes the anomaly 0�C in the year 1900 for the added polynomial trend.


This gives an idea of how much temperatures have risen since the year 1900, with a rise for both February and March 2016 showing up that was more than 1.5�C, as also illustrated by the image below. The trend further points at temperature anomalies that will be more than 1.5�C within a decade and more than 2�C soon thereafter.


Historical Temperatures


To calculate by how much warming humans have caused since pre-industrial times, we need to go back further than 1900. The graph below shows that carbon dioxide concentrations have gone up and down between roughly 180 ppm and 280 ppm over the past 800,000 years and did recently reach a peak of 411 ppm (peak hourly average on May 11, 2016).


The graph below, from an earlier post, shows how in the past, over the past 420,000 years, temperatures (and levels of CO2 and CH4) have gone up and down by some 10�C, in line with the Milankovitch cycles.


Historically, carbon dioxide rises of 100 ppm have gone hand in hand with temperature rises of some 10�C. The recent rise in carbon dioxide concentrations is a 131 ppm rise (from some 280 ppm to 411 ppm). The rise in methane concentrations is even steeper. Could we therefore expect a temperature rise of more than 10�C to happen, and if so how soon could this eventuate? As described below, warming caused by humans could result in a temperature rise of more than 10�C (18�F) within a decade.

The graph on the right, created by Jos Hagelaars, shows that, during the most current cycle, temperatures reached a peak some 7000 years ago (in the blue part of the graph).

The graph underneath, based on work by Marcott et al., focuses on this blue part of the graph, while using a 1961-1990 baseline. Temperatures reached a peak some 7000 years ago, and then came down to reach a low a few hundred years ago.

The peak and the bottom temperatures (highlighted in red on image) over the period suggest a fall of more than 0.7�C.

A few hundred years ago, temperatures were falling and they would have kept falling, in line with the Milankovitch cycles, had there been no warming caused by humans.

From that bottom point, temperatures first rose by about 0.4�C, overwhelming the downward trend that would otherwise have taken temperatures down further, and then there was an additional rise of at least 1.05�C, when using a baseline of 1961-1990. That may suggest that humans have caused a total of 1.45�C warming.

Humans have caused even more warming

The situation looks to be even worse than what the above figures may suggest. Indeed, the bottom low point in the Marcott graph would have been even lower had there been no warming by humans. 

Temperatures before 1900 were already higher than what they would have been had humans caused no warming. The fact that humans did cause substantial warming between 1800 and 1900 is illustrated by the graph below, from a recent post by Michael Mann, who adds that some 0.3�C greenhouse warming had already taken place between the year 1800 and the year 1900.
Some 0.3C greenhouse warming had already taken place by 1900, and some 0.2C warming by 1870
Further studies suggest that humans also caused substantial warming well before 1800, as illustrated by the image on the right. While this study focuses on Europe, it does suggest a rise from 1600 to 1800.

Another example of warming caused by humans before 1800 is presented in research by Dull et al., which suggests that burning of Neotropical forests increased steadily in the Americas, peaking at a time when Europeans arrived in the late fifteenth century. By 1650, some 95% of the indigenous population had perished. Regrowth of forests led to carbon sequestration of some 2 to 5 Pg C, thereby contributing to a fall in atmospheric carbon dioxide recorded in Antarctic ice cores from about 1500 through 1750.

Paris Agreement

NASA data suggest that it was 1.48�C (or 2.664�F) warmer than in 1890-1910 for the period from November 2015 to April 2016. Note again that this 1890-1910 baseline is much later than pre-industrial times. The Paris Agreement had pledged to limit the temperature rise to 1.5�C above pre-industrial levels. On land on the Northern Hemisphere, it was 1.99�C (or 3.582�F) warmer (right map of the image below).

[ Temperature anomalies for the period from November 2015 to April 2016, see also comments ]
The above images only account for a half-year period, so they are only indicative for the total rise for the year 2016. Nonetheless, when taking into account warming caused by people before 1900, the year 2016 looks set to exceed the guardrails that the Paris Agreement had pledged would not be crossed. The situation looks even worse when considering that temperatures measured in ice cores already included a substantial amount of warming due to humans even before the start of the Industrial Revolution.

February 2016 was 1.67�C (3�F) warmer than 1890-1910
Again, at the Paris Agreement nations pledged to hold the increase in the global average temperature to well below 2�C above pre-industrial levels and to pursue efforts to limit the temperature increase to 1.5�C above pre-industrial levels.

When looking at a single month, February 2016 was 1.67�C (3�F) warmer than 1890-1910 (see image right). When adding a mere 0.34�C to account for warming before 1900, total warming in February 2016 did exceed 2�C. Looking at it that way, the guardrails set in Paris in December 2015 were already crossed in February 2016.

Situation

So, what is the situation? On the one hand, there's the current observed temperature rise (?O). This rise is typically calculated as the difference between the current temperature and the temperature at a given baseline.

However, this ?O does not reflect the full impact of human emissions. Temperatures would have been lower had there been no emissions by humans. The full warming impact due to people's emissions therefore is ?E. This ?E is higher than the often-used observed rise, since the baseline would have been lower without warming caused by humans.

At the same time, part of global warming caused by people is currently masked due the aerosol emissions (?A). Such aerosol emissions result from mainly burning of fossil fuel and biomass. There's no doubt that such emissions should be reduced, but the fact remains that the current temperature rise may increase substantially, say, by half when the masking effect disappears.

Thus, the full (unmasked) warming caused by humans is the sum of these two, i.e. ?E + ?A, and the sum could be as high as 3�C or even more than 5�C.

In addition, there is a future temperature rise that's already baked into the cake (?F). Some feedbacks are not yet very noticeable, since some changes take time to become more manifest, such as melting of sea ice and non-linear changes due to feedbacks that are only now starting to kick in. Furthermore, the full effect of CO2 emissions reaches its peak only a decade after emission, while even with the best efforts, humans are likely to still be causing additional emissions over the coming decade. All such factors could jointly result in a temperature rise greater than ?E + ?A together, i.e. ?F could alone cause a temperature rise of more than 5�C within a decade.

In summary, total warming caused by humans (?E + ?A + ?F) could be more than 10�C (18�F) within one decade, assuming that no geoengineering will take place within a decade.

The situation is dire and calls for comprehensive and effective action as described in the Climate Plan.


Links

- Methane Erupting From East Siberian Arctic Shelf
http://arctic-news.blogspot.com/2014/11/methane-erupting-from-east-siberian-arctic-shelf.html

- Jos Hagelaars' graph, created with graphs by Shakun et al., Marcott et al. and more, is at:
https://ourchangingclimate.wordpress.com/2013/03/19/the-two-epochs-of-marcott/

- Global warming preceded by increasing carbon dioxide concentrations during the last deglaciation, by Shakun et al. http://www.nature.com/nature/journal/v484/n7392/full/nature10915.html

- A Reconstruction of Regional and Global Temperature for the Past 11,300 Years, by Marcott et al.
http://science.sciencemag.org/content/339/6124/1198

- The Columbian Encounter and the Little Ice Age: Abrupt Land Use Change, Fire, and Greenhouse Forcing, by Dull et al., in:
https://www.sciencenews.org/article/columbus-arrival-linked-carbon-dioxide-drop

- Arctic Climate Records Melting
http://arctic-news.blogspot.com/2016/05/arctic-climate-records-melting.html

- 2500 Years of European Climate Variability and Human Susceptibility, Ulf B�ntgen et al. (2011)